Example Session in PRTools
Note: This website is outdated and reconstructed for historical reasons.
Although manuals and books are nice, nothing is more enlightening than an example session in Matlab to give an impression of PRTools. Let us define a task. The task is to generate some artificial data, train a few classifiers on it, estimate the error of the classifiers and make a plot of their decision boundaries.
First generate some artificial 2D data, and split it in a training and test set. In this example we use 20% for training, and the remaining 80% will be used for testing.
>> A = gendatb([50 50]); >> [C,D] = gendat(A,0.2);
Next, we train two classifiers on the training set, a quadratic classifier and a k-nearest neighbor classifier (with k=3).
>> w1 = qdc(C); >> w2 = knnc(C,3);
Objects from the test set can be evaluated by the classifier by mapping the dataset using the classifier:
>> mappedD = D*w1
To obtain the classification labels, use
>> labels = mappedD*labeld
Estimate the error of both classifiers on the test set
>> err1 = D*w1*testc >> err2 = D*w2*testc
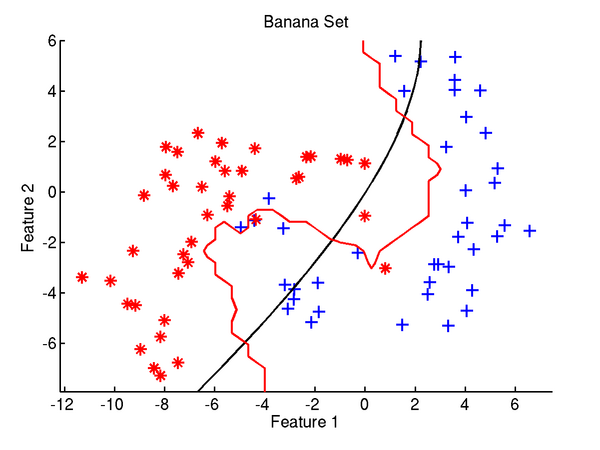
We are dealing with a 2D dataset so we can make a scatterplot of this data and plot the decision boundary in it.
>> figure(1); clf; >> scatterd(D); >> plotc(w1,'k'); >> plotc(w2,'r');
The result might look something like: